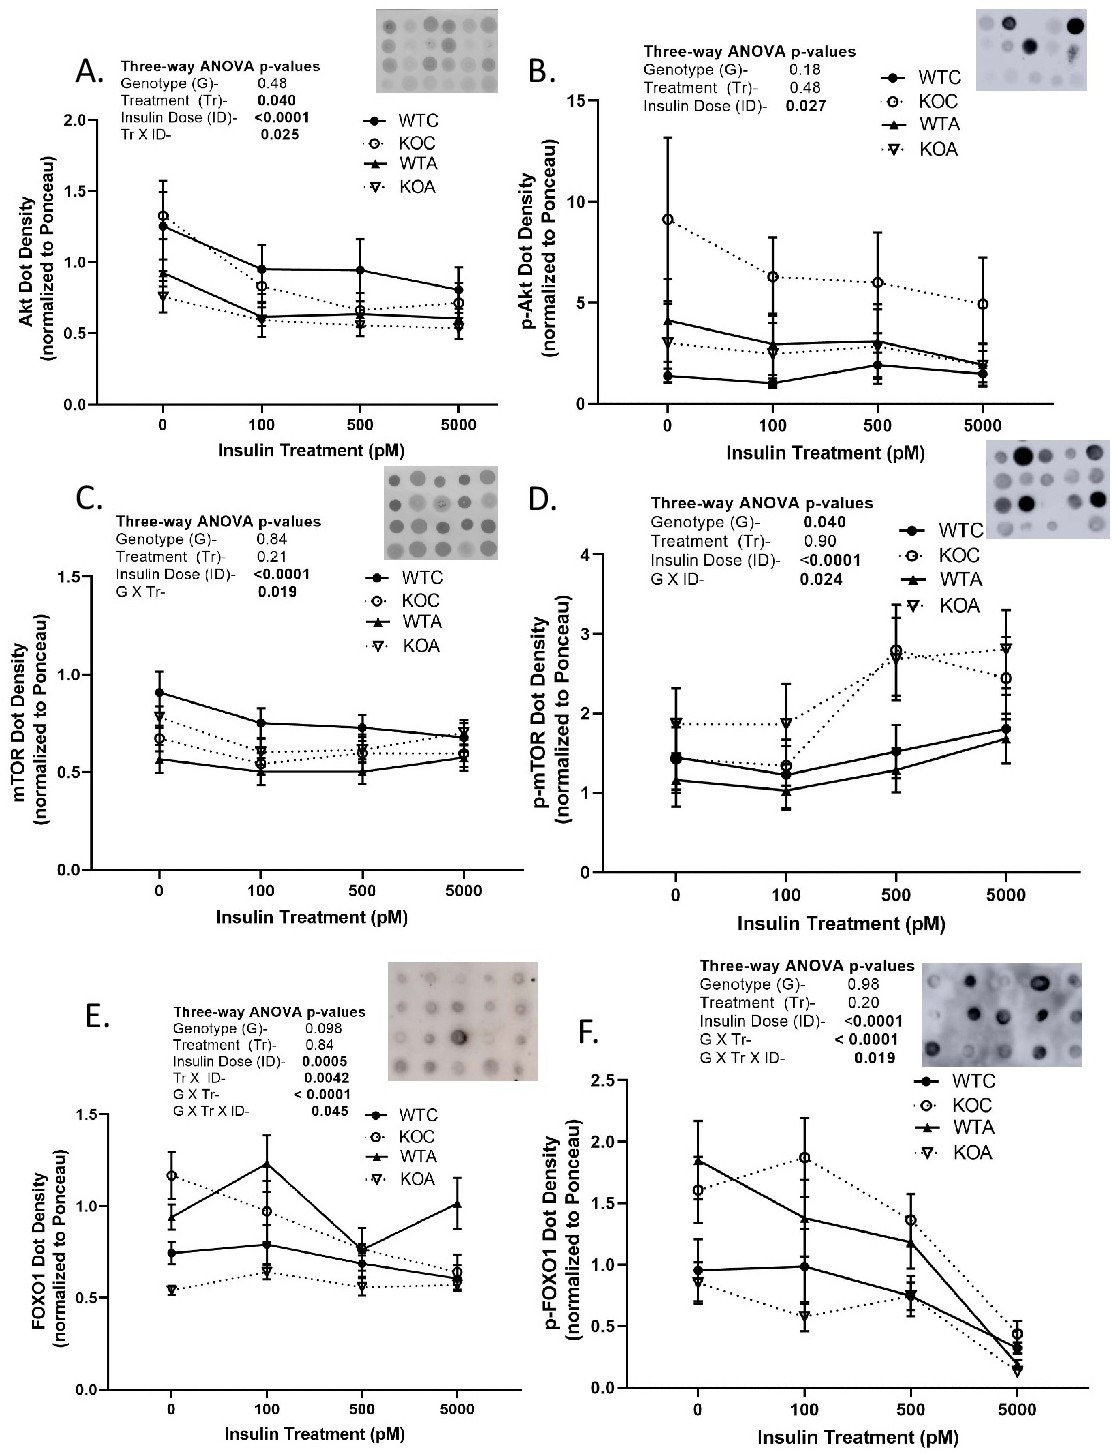
Fig. 6. Insulin signaling in proximal tubule (PT) suspensions. WT and KO mice (n = 5-6/sex/genotype/treatment) were treated under control or acid-loading for 1-week and PT suspensions prepared and incubated with different concentrations of insulin for 70 minutes then cold centrifuged. Protein from pellets was solubilized for dot blotting (5 µl) and density was normalized to Ponceau staining. Representative dot blot and density summary for A. Akt; B. pS473-Akt; C. mTOR; D. pS2448-mTOR; E. FOXO1; and F. pS256-FOXO1. Results of 3-way repeated measures ANOVA are shown in inserts; p<0.05 considered significant; closed circles- WT control, open circles- KO control; closed triangles- WT acid; open triangles- KO acid.